I. The Invisible Spectrum: Why I Chose Light to Smell
The Invisible Spectrum: Why I Chose Light to Smell
Phase I: 2022 - Foundations & Physics
When I first encountered the concept of a “Photonic Nose,” I wasn’t just thinking about sensors; I was thinking about the limitations of human perception. We trust our eyes implicitly, but our sense of smell—the oldest, most primal sense—is often too slow, too weak, or too late to warn us of invisible dangers.
In 2022, I asked myself: What if we could “see” smell with the precision of a laser?
This question launched a three-year journey that would take me from the abstract equations of the Beer-Lambert Law to the messy, real-world challenges of medical diagnostics.
The Physics of “Seeing” Gas
My initial work wasn’t glamorous. It was spent in front of a monitor, tweaking parameters in COMSOL Multiphysics, trying to simulate how photons interact with gas molecules.
The core principle is elegant but unforgiving: every molecule has a unique “fingerprint”—a specific set of wavelengths it absorbs. If you shoot a laser beam through a gas chamber and measure what comes out the other side, the missing light tells you exactly what’s inside.
I(\lambda) = I_0(\lambda) \cdot e^{-\alpha(\lambda) \cdot c \cdot L}
This equation became my daily reality. $I$ is what we detect, $I_0$ is what we send, and buried in that exponent is the concentration $c$—the answer we’re looking for.
Breaking Lithium Batteries (For Science)
One of the most intense periods of this phase was studying lithium-ion battery safety. We know batteries are dangerous, but how do they fail? I wanted to catch the chemical precursors to thermal runaway.
I designed an experiment to stress-test batteries and analyze their off-gassing. The results were startlingly clear. In an oxygen-deprived environment (mimicking the inside of a battery pack), the failing cells didn’t just get hot; they screamed in chemical signals.
Here is the data I collected from our gas chromatography tests:
| Gas Marker | Concentration (Nitrogen Environment) | Implications |
|---|---|---|
| Hydrogen (H₂) | 25.3% | The definitive sign of electrolyte breakdown. |
| Methane (CH₄) | 17.6% | Early-stage decomposition indicator. |
| CO₂ | 38.2% | Combustion byproduct (if oxygen is present). |
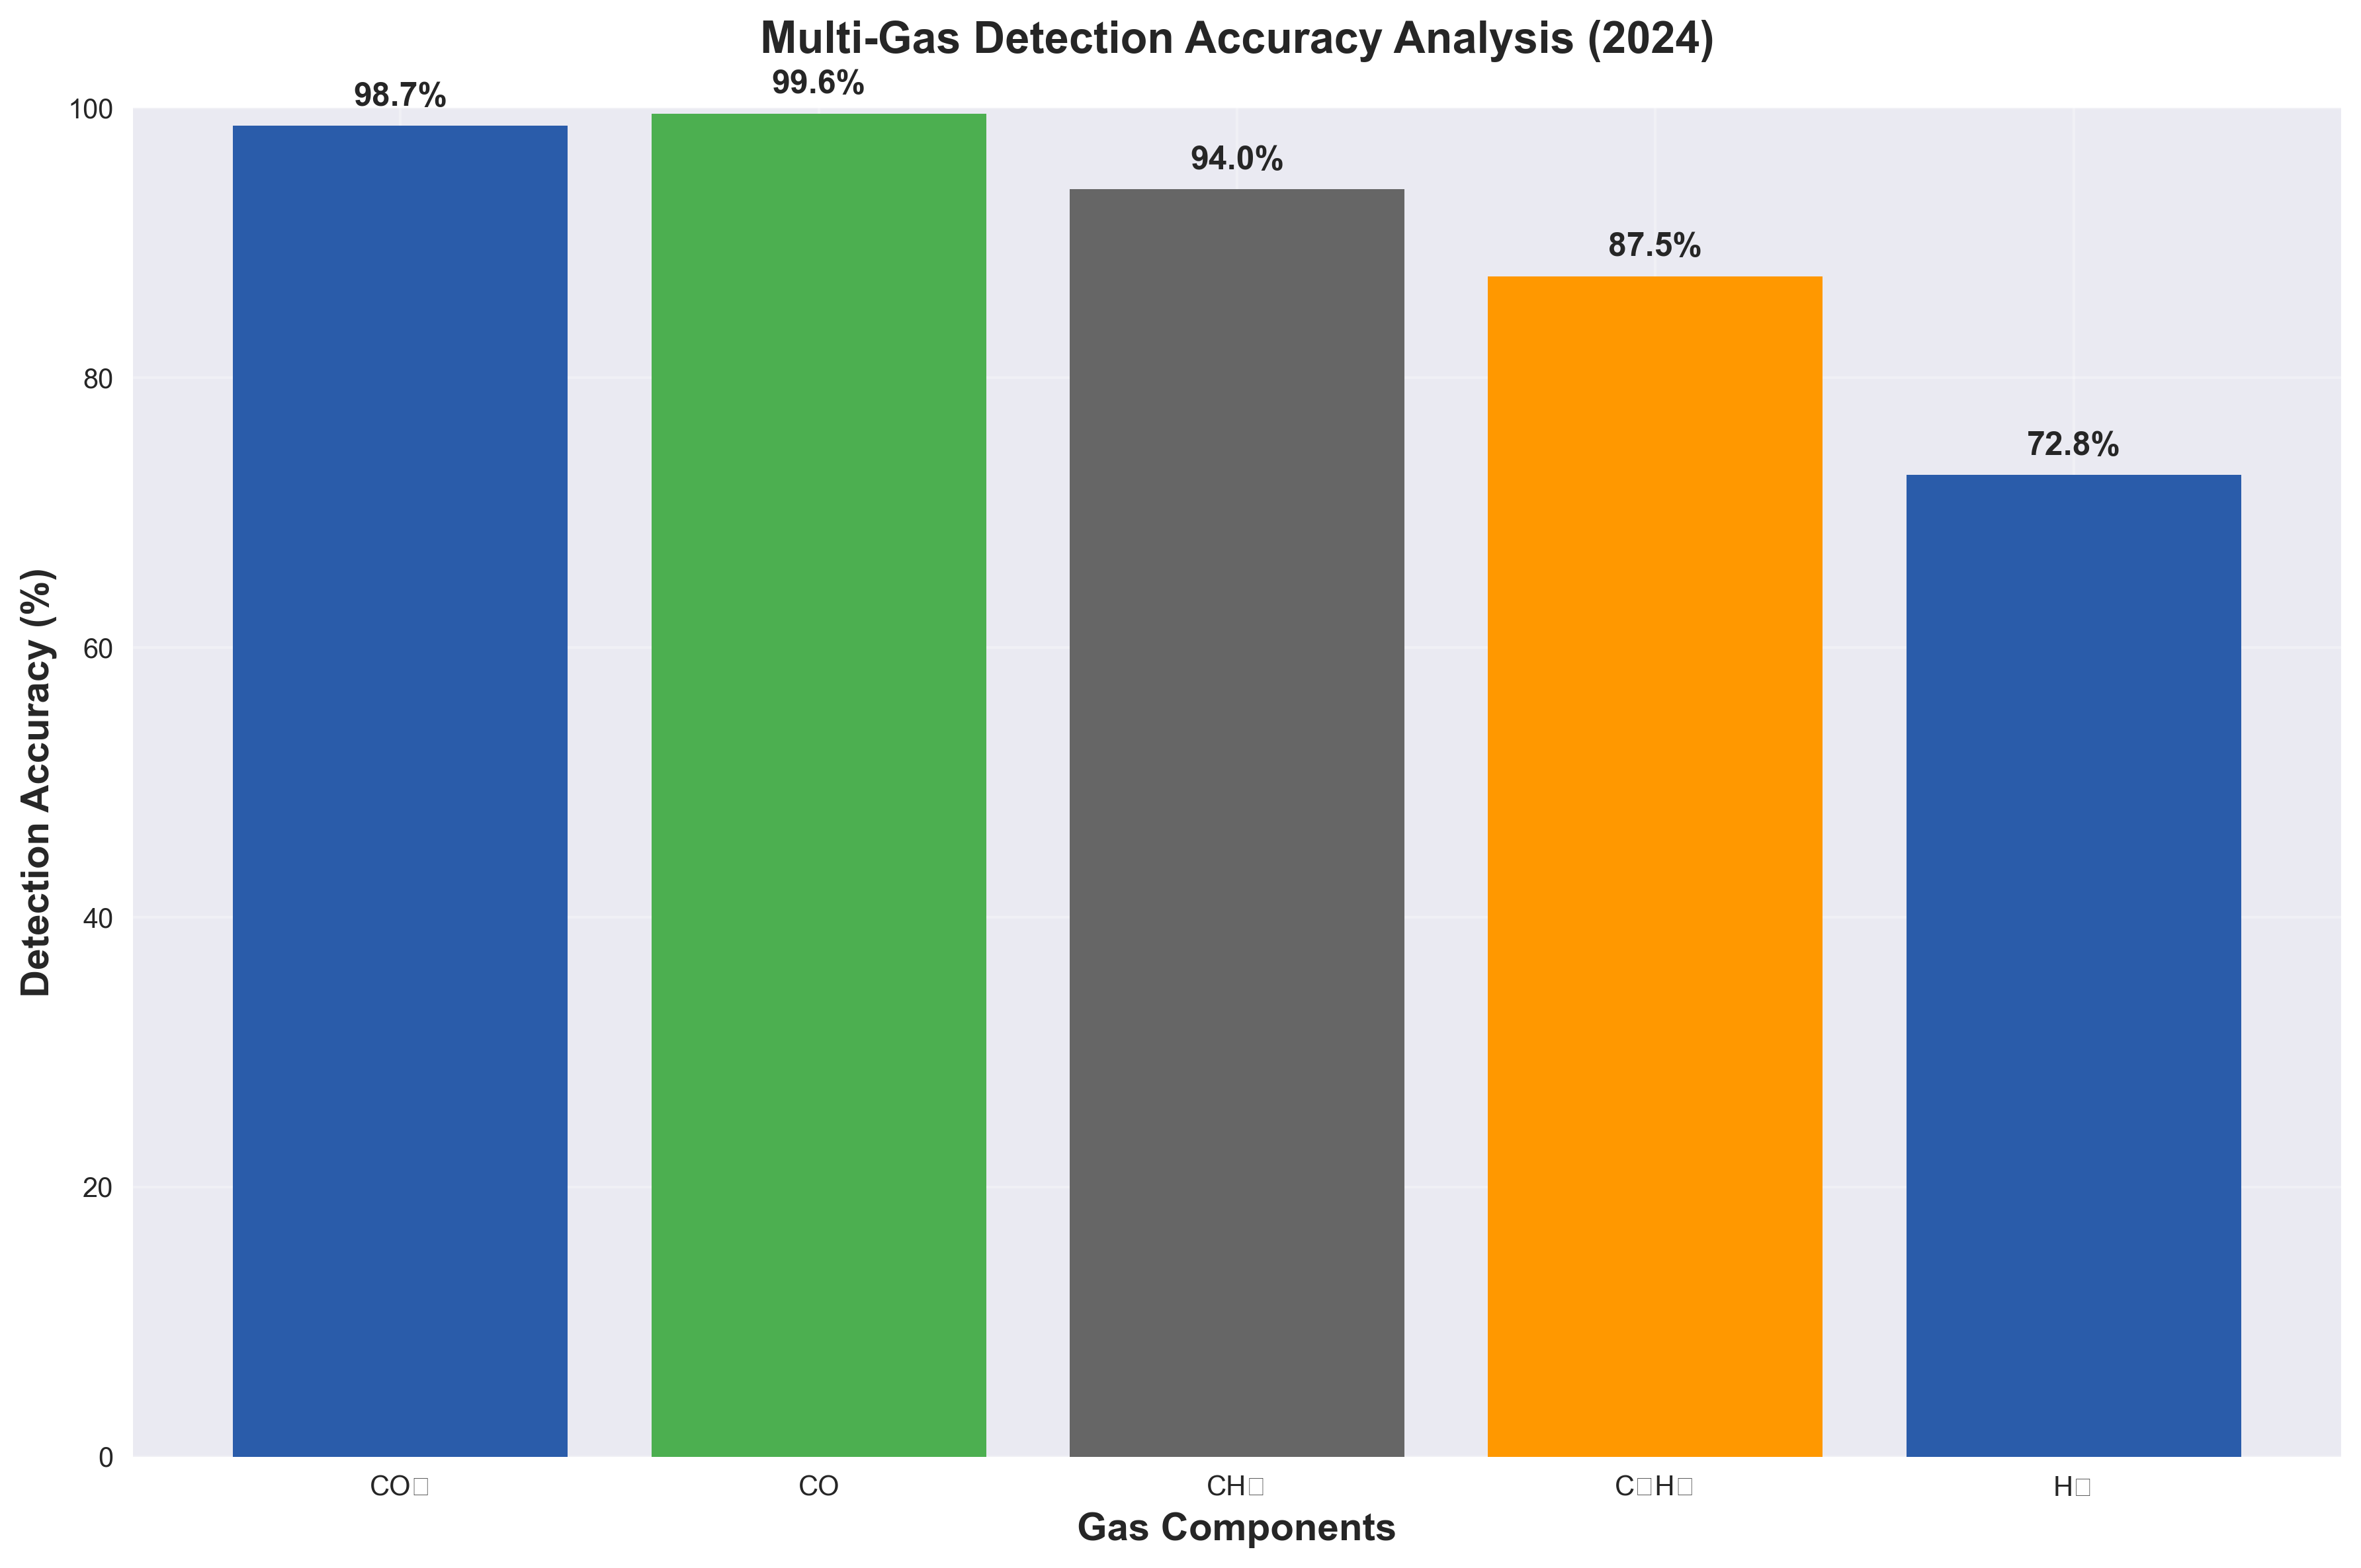
This data was my proof of concept. Hydrogen is the canary in the coal mine. While a thermal sensor waits for heat (which might be too late), our optical sensor could detect that spike in H₂ the moment the chemical bonds started snapping.
Learning to Solder Light
Simulations are safe; the lab is not. I had to learn fiber optic welding—a delicate art where a micron of misalignment means zero signal. I burned through meters of fiber and countless hours aligning tunable laser sources.
But the moment I saw the first clear absorption dip on the oscilloscope—the signature of CO₂—it felt like magic. I wasn’t just looking at a screen; I was seeing the breath of the machine.
This foundational year taught me that hardware is hard, but physics is faithful. If you respect the laws, they will give you the truth. But raw data is just noise to most people. I realized that to make this technology truly useful, I needed to make it visible.
Next: How I turned these invisible numbers into a Digital Twin.